|
|
1
|
2
|
3
|
4
|
5
|
6
|
|
7
|
8
|
9
|
10
|
11
|
12
|
13
|
|
14
|
15
|
16
|
17
|
18
|
19
|
20
|
|
21
|
22
|
23
|
24
|
25
|
26
|
27
|
|
28
|
29
|
30
|
|
|
|
|
|
|
126 registered members (Bread, mashburn, Turkey, Buckwheat, rrice0725, BradB, low wall, abolt300, Snuffy, eclipse829, jacannon, johnv, Dixiepatriot, CNC, Cynical, Herdbull, The Big Cheese, coldtrail, Whild_Bill, Downwind, desertdog, catdoctor, Backwards cowboy, hunter84, Chaser357, Turkey_neck, ShaftOne, Ben Downs, Rockstar007, Whitetaillane, NVM1031, PineTop, IDOT, HSV. HUNTER, AU7MM08, Bigem1958, Chancetribe, Geeb, foldemup, KnightRyder, BRP549, Shmoe, Uokman2014, BCLC, HHSyelper, Bowfish, joeml18, UncleHuck, NWFJ, oldforester, Brownitsdown, outdoorguy88, jake44, Shaneomac2, CAL, Semo, Squadron77, blade, Solothurn, Noler_Swamp, hallb, Young20, BACK40, Blessed, claybird, BamaGuitarDude, Fullthrottle, beeline08, Chaser1, Butchman205, BuckRidge17, Chad Burnette, BhamFred, Bows4evr, Gobble4me757, auman, Ol’Tom, gobblebox, twaldrop4, BrentsFX4, Hoytdad10, nate409, AKB, SwampHunter, riflenut, top cat, Obsession, Brian_C, Gary Harris, mossyback, biglmbass, BCD, beRAD, AustinC, Big Al, Turkeyneck78, CeeHawk37, CarbonClimber1, aubigmac, Justice, fur_n_feathers, AU338MAG, Ridge Life, FreeStateHunter, Chiller, ts1979flh, BurningBright, Lockjaw, dixiebuck29, jarcher38, Andalusia, doghouse, 14 invisible),
516
guests, and 0
spiders. |
|
Key:
Admin,
Global Mod,
Mod
|
|
|
 Re: Explaining conception date map
[Re: NightHunter]
#1672079
Re: Explaining conception date map
[Re: NightHunter]
#1672079
03/02/16 07:37 AM
03/02/16 07:37 AM
|
Joined: Jan 2007
Posts: 13,739
Hoover
burbank

Booner
|
Booner
Joined: Jan 2007
Posts: 13,739
Hoover
|
Not a biologist, but I believe the theory on mature bucks is correct. Matt, conception question, can you see a temporary shift in primary breeding dates over your 3-5 year study, more than say just a few days?
Any areas showing a permanent shift?
Where I'm headed is we always hear , "our rut has shifted" or "we didn't have a rut this season". Never bought into that myself. We have seen some individual properties move up and some move later as much as 10-15 days if I recall correctly but widespread we have not seen anything like that. On one place in particular where this happened we have a very good relationship with the club and harvest/observation data. The couple years that it shifted late were proceeded by a couple of years that they were very successful a harvesting their mature bucks down through the 3.5 year old age class. We theorized that this impacted the efficiency at which the does were bred the following seasons. Obviously there was immigration/emigration of bucks into the population but most of the ones identified on camera were harvested the year they showed up.
|
|
|
Re: Explaining conception date map
[Re: burbank]
#1672091
03/02/16 07:54 AM
03/02/16 07:54 AM
|
Joined: Jan 2009
Posts: 7,780
central ala,
centralala
14 point
|
14 point
Joined: Jan 2009
Posts: 7,780
central ala,
|
Not a biologist, but I believe the theory on mature bucks is correct. Matt, conception question, can you see a temporary shift in primary breeding dates over your 3-5 year study, more than say just a few days?
Any areas showing a permanent shift?
Where I'm headed is we always hear , "our rut has shifted" or "we didn't have a rut this season". Never bought into that myself. We have seen some individual properties move up and some move later as much as 10-15 days if I recall correctly but widespread we have not seen anything like that. On one place in particular where this happened we have a very good relationship with the club and harvest/observation data. The couple years that it shifted late were proceeded by a couple of years that they were very successful a harvesting their mature bucks down through the 3.5 year old age class. We theorized that this impacted the efficiency at which the does were bred the following seasons. Obviously there was immigration/emigration of bucks into the population but most of the ones identified on camera were harvested the year they showed up. Gonna have to explain the mature buck theory better to me. Typing slowly will help me understand.  If the mature bucks are killed then this leaves the young bucks to do the breeding. The young bucks are less efficient than mature bucks at getting the job done. Here is where you lose me. The does are in estrous for a certain time then go out and back in at approx. 28 days until bred. So, if the young bucks don't get the job done shouldn't the shift be 28 days instead of 15 due to the doe going out of estrous??
|
|
|
Re: Explaining conception date map
[Re: centralala]
#1672097
03/02/16 08:01 AM
03/02/16 08:01 AM
|
Joined: Sep 2007
Posts: 6,999
Holly Pond, AL
NightHunter
10 point
|
10 point
Joined: Sep 2007
Posts: 6,999
Holly Pond, AL
|
So, if the young bucks don't get the job done shouldn't the shift be 28 days instead of 15 due to the doe going out of estrous?? The thing you have to remember is that it is an average. So we have early breeders too. I imagine if it went on very long that it could end up being a permanent shift due to two things. One, inefficient breeding and two a more unbalanced ratio. It did not last more than a couple of years though. They have laid off the 3.5 year olds. We will see what happens this year. It will be interesting.
Last edited by NightHunter; 03/02/16 08:55 AM.
|
|
|
Re: Explaining conception date map
[Re: NightHunter]
#1672110
03/02/16 08:08 AM
03/02/16 08:08 AM
|
Joined: Jan 2009
Posts: 7,780
central ala,
centralala
14 point
|
14 point
Joined: Jan 2009
Posts: 7,780
central ala,
|
So, if the young bucks don't get the job done shouldn't the shift be 28 days instead of 15 due to the doe going out of estrous?? The thing you have to remember is that it is an average. So we have early breeders too. I imagine if it went on very long that it could end up being a permanent shift due to two things. One, inefficient breeding and two a more unbalanced ratio. It did not last more than a couple of years though. They have laid of the 3.5 year olds. We will see what happens this year. It will be interesting. You typed slow enough that even I got that. Forgot AVERAGE. Enough were bred in the 2nd estrous to shift the AVERAGE. Gotcha!! For me I would really be interested in all the dates from the test in the MAIN cycle...or the best guess. Realize their will be some earlier and later, but I would find the time and date spread interesting. In other words, removing the outliers.
|
|
|
Re: Explaining conception date map
[Re: centralala]
#1672212
03/02/16 09:30 AM
03/02/16 09:30 AM
|
Joined: Jul 2011
Posts: 34,430
Boxes Cove
2Dogs
Freak of Nature
|
Freak of Nature
Joined: Jul 2011
Posts: 34,430
Boxes Cove
|
So, if the young bucks don't get the job done shouldn't the shift be 28 days instead of 15 due to the doe going out of estrous?? The thing you have to remember is that it is an average. So we have early breeders too. I imagine if it went on very long that it could end up being a permanent shift due to two things. One, inefficient breeding and two a more unbalanced ratio. It did not last more than a couple of years though. They have laid of the 3.5 year olds. We will see what happens this year. It will be interesting. You typed slow enough that even I got that. Forgot AVERAGE. Enough were bred in the 2nd estrous to shift the AVERAGE. Gotcha!! For me I would really be interested in all the dates from the test in the MAIN cycle...or the best guess. Realize their will be some earlier and later, but I would find the time and date spread interesting. In other words, removing the outliers.  Would love to see this plotted on a bell curve , then look at the most probable event or peak, primary breeding times. That would probably change the conception map, making it more accurate.
"Why do you ask"?
Always vote the slowest path to socialism.
|
|
|
Re: Explaining conception date map
[Re: Mbrock]
#1672322
03/02/16 10:48 AM
03/02/16 10:48 AM
|
Joined: Nov 2013
Posts: 10,329
coffee county
goodman_hunter

Booner
|
Booner
Joined: Nov 2013
Posts: 10,329
coffee county
|
are the outlier young or old does or mix match. And why do you contribute the young bucks for not being as efficient?
For without victory, there is no survival
|
|
|
Re: Explaining conception date map
[Re: Mbrock]
#1672403
03/02/16 12:04 PM
03/02/16 12:04 PM
|
Joined: Jun 2012
Posts: 21,750
Awbarn, AL
CNC
Dances With Weeds
|
Dances With Weeds
Joined: Jun 2012
Posts: 21,750
Awbarn, AL
|
I�d have to guess it looks something like this 2dogs. Again though, it will depend on the buck to doe ratio and how efficiently the does are bred in the first cycle. If you had a better ratio then you may have a much higher hump in the front and a much smaller one in the back. In which case, the avg would move to the left or earlier. 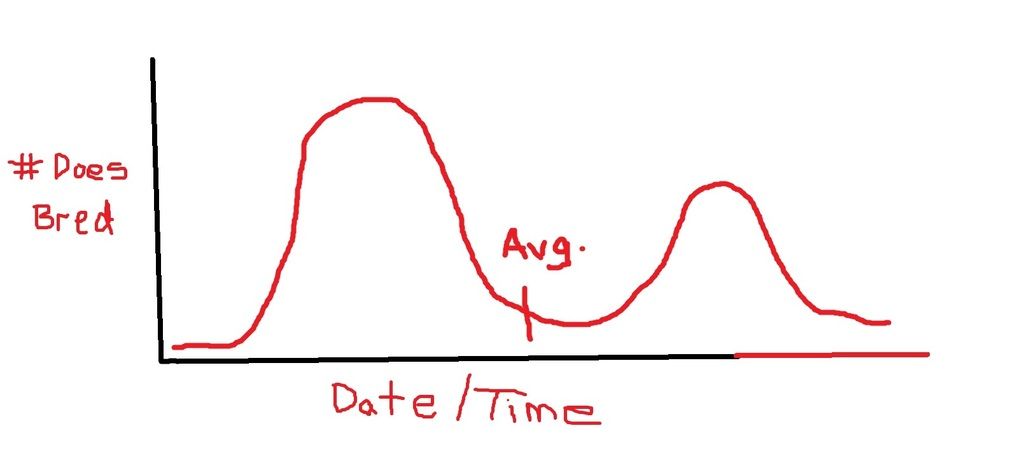
Last edited by CNC; 03/02/16 12:07 PM.
We dont rent pigs
|
|
|
Re: Explaining conception date map
[Re: 2Dogs]
#1672488
03/02/16 01:34 PM
03/02/16 01:34 PM
|
Joined: Jan 2009
Posts: 7,780
central ala,
centralala
14 point
|
14 point
Joined: Jan 2009
Posts: 7,780
central ala,
|
That's what one could look like for the entire rut, both primary and secondary. I'd like to see some plotted for primary only and primary and secondary. I'd like to see how many areas peak primary breeding dates fall before Feb.1. That map would be useful.
Well, that is what I was trying to say. The average conception date may be of use to biologist and their decision making for not so much for the hunter. Even the average date of the primary rut would be of little use to the hunters that I can see except for it's very interesting and some may adjust their vacation times according to those dates. For me, it's really more to see if I'm right or wrong about what I think is going on.
|
|
|
Re: Explaining conception date map
[Re: 2Dogs]
#1672514
03/02/16 02:02 PM
03/02/16 02:02 PM
|
Joined: Jun 2012
Posts: 21,750
Awbarn, AL
CNC
Dances With Weeds
|
Dances With Weeds
Joined: Jun 2012
Posts: 21,750
Awbarn, AL
|
[That's what one could look like for the entire rut, both primary and secondary. I'd like to see some plotted for primary only and primary and secondary. I'd like to see how many areas peak primary breeding dates fall before Feb.1. That map would be useful. We could start with central Jackson Co.  It would look the exact same as what I just posted minus the second hump. The date you are looking for is the peak of the first hump either way.....or a time frame around it. Say we improve the buck/doe ratio or the �efficiency� with which the does are being bred then the peak of the first hump would just get taller. I don�t think the date would actually change that much. The average changes though. I don�t think they pull enough samples to be able to plot something to this extent. It just wouldn�t be feasible. 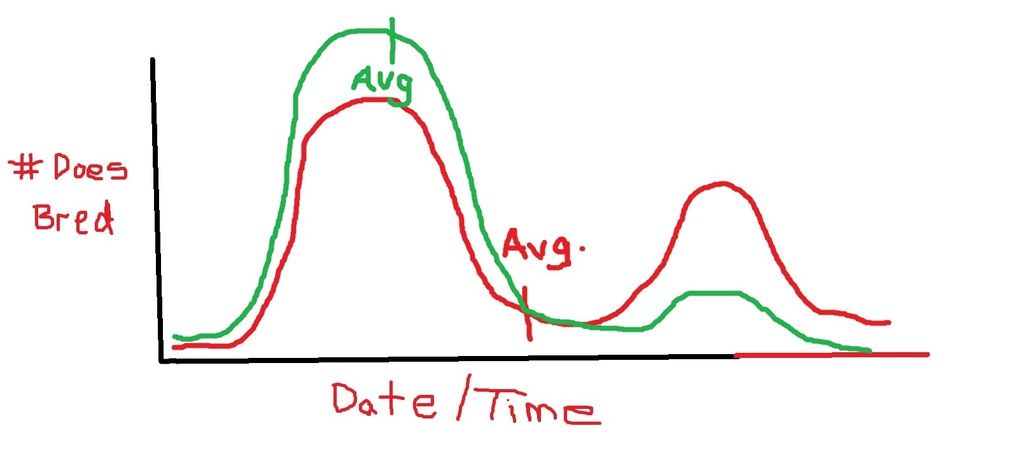
Last edited by CNC; 03/02/16 02:04 PM.
We dont rent pigs
|
|
|
Re: Explaining conception date map
[Re: Mbrock]
#1672808
03/02/16 05:23 PM
03/02/16 05:23 PM
|
Joined: Dec 2007
Posts: 4,617
Bay Minette, AL
scrubbuck
10 point
|
10 point
Joined: Dec 2007
Posts: 4,617
Bay Minette, AL
|
So how do you guys propose we determine what's a second cycle deer? I have my own opinions, based on the timing "most" does enter estrous, but it's not a fail proof method, as it really isn't scientific. It's just playing the game of probabilities. There are not well defined cycles in some populations. Populations in some areas seem to have influences from several stocking sources, and there are huge differences in populations in very close proximity to each other. We really have no choice but to take all samples into account. In Cullman County, in an area with a very low population there were deer collected in the past with breeding dates from September to March. I wouldn't think it is the result of a severely skewed sex ratio there. I really have no explanation. Use a method called 85th percentile. It's the same method used by engineers to perform traffic speed studies and assists in determining appropriate speed limits on roads. It removes the extreme low and high outliers to give a more accurate representation of data. The Cullman county example is extreme and I can see where it would be of little value there, unless the Sept & March dates were themselves just extreme outliers vs the rest of the data.
|
|
|
Re: Explaining conception date map
[Re: Mbrock]
#1673015
03/03/16 01:23 AM
03/03/16 01:23 AM
|
Joined: Jan 2009
Posts: 7,780
central ala,
centralala
14 point
|
14 point
Joined: Jan 2009
Posts: 7,780
central ala,
|
Agree with he 85th percentile for what ever that is worth.
Now, as I said, everything ikillbux has said has been true for me for over 30 years on 1 property. So, how do hunters use the conception dates?? I'll throw out a PURELY HYPOTHETICAL situation: All does are found to be bred in a time frame of Jan. 10 - Jan. 25 with the majority being bred on Jan 18. You can hunt ONLY 5 consecutive days. The choices are Jan. 10-15, Jan. 16-20, or Jan. 21-25?? Purely HUNTER standpoint. For me, in what ikillbux described, I would lean heavily toward Jan. 21-25. The competition for does are greater and new bucks are showing up.
|
|
|
Re: Explaining conception date map
[Re: centralala]
#1673138
03/03/16 04:55 AM
03/03/16 04:55 AM
|
Joined: Jul 2011
Posts: 34,430
Boxes Cove
2Dogs
Freak of Nature
|
Freak of Nature
Joined: Jul 2011
Posts: 34,430
Boxes Cove
|
That's what one could look like for the entire rut, both primary and secondary. I'd like to see some plotted for primary only and primary and secondary. I'd like to see how many areas peak primary breeding dates fall before Feb.1. That map would be useful.
Well, that is what I was trying to say. The average conception date may be of use to biologist and their decision making for not so much for the hunter. Even the average date of the primary rut would be of little use to the hunters that I can see except for it's very interesting and some may adjust their vacation times according to those dates. For me, it's really more to see if I'm right or wrong about what I think is going on. My angle with the bell curve 85 percentile , primary rut, versus a average of all breeding is this February season for the whole state. I think only the primary breeding period peek days should be taken into consideration. I'm looking for any ammo possible to stop February hunting in Jackson Co. However, that info could be helpful for hunters too.
"Why do you ask"?
Always vote the slowest path to socialism.
|
|
|
Re: Explaining conception date map
[Re: Mbrock]
#1673139
03/03/16 04:55 AM
03/03/16 04:55 AM
|
Joined: Nov 2013
Posts: 10,329
coffee county
goodman_hunter
Booner
|
Booner
Joined: Nov 2013
Posts: 10,329
coffee county
|
at first i was with you guys about the average dat kinda throwing off when you would take vacation days to hunt. But after some ponder it got me to wondering if the average dat might actually be better. My thinking, which could be wrong. First breeding kicks in, there locked down breeding. between then and next breeding cycle, bucks start running around looking for other does, maybe more movement, if the weather is cooler. What say yall?
I know the more you hunt the better your chances are, but if you was only going to take a week off to hunt, were on the graph do you think the most buck movement would be
For without victory, there is no survival
|
|
|
Re: Explaining conception date map
[Re: goodman_hunter]
#1673173
03/03/16 05:25 AM
03/03/16 05:25 AM
|
Joined: Jun 2012
Posts: 21,750
Awbarn, AL
CNC
Dances With Weeds
|
Dances With Weeds
Joined: Jun 2012
Posts: 21,750
Awbarn, AL
|
at first i was with you guys about the average dat kinda throwing off when you would take vacation days to hunt. But after some ponder it got me to wondering if the average dat might actually be better. My thinking, which could be wrong. First breeding kicks in, there locked down breeding. between then and next breeding cycle, bucks start running around looking for other does, maybe more movement, if the weather is cooler. What say yall?
I know the more you hunt the better your chances are, but if you was only going to take a week off to hunt, were on the graph do you think the most buck movement would be I think if we had the buck harvest data for a county plotted on the same graph then it would really help you answer that question. I imagine it would be a nice curve as well that fell just ahead of peak breeding. Something of this nature...... 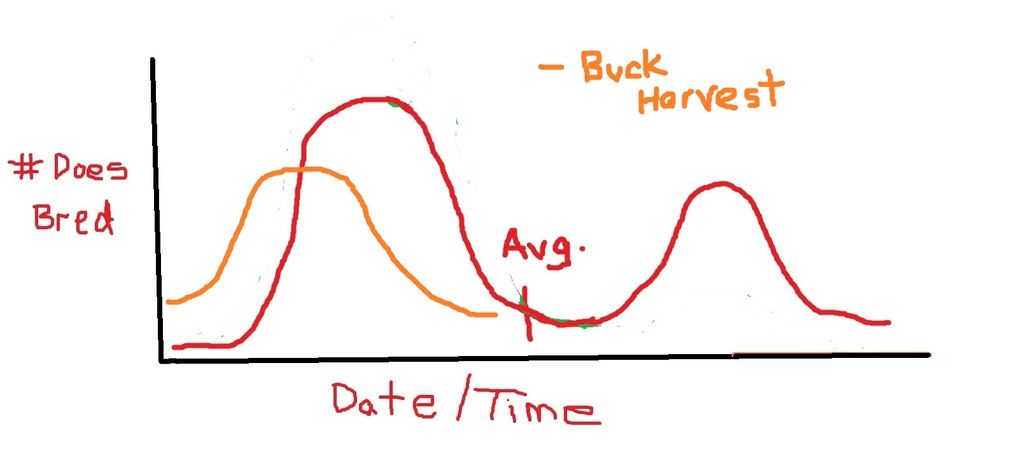
Last edited by CNC; 03/03/16 05:38 AM.
We dont rent pigs
|
|
|
Re: Explaining conception date map
[Re: mman]
#1673326
03/03/16 07:15 AM
03/03/16 07:15 AM
|
Joined: Jul 2011
Posts: 34,430
Boxes Cove
2Dogs
Freak of Nature
|
Freak of Nature
Joined: Jul 2011
Posts: 34,430
Boxes Cove
|
I would love to see/have the raw data, but I'm weird that way I can see why an average is used, but it is possible that no does were actually bred on or around that average date. To me, I want to know in which week (5 or 7 day period, or even a two week period) were the most does bred in my area. That seems to me like that would be the peak of the rut. If that was calculated by year, then you could easily see changes from year to year and also take an overall average to see when the peak of the rut normally occurs for an area. Then you could also determine secondary peaks. You got it.
"Why do you ask"?
Always vote the slowest path to socialism.
|
|
|
Re: Explaining conception date map
[Re: goodman_hunter]
#1673332
03/03/16 07:17 AM
03/03/16 07:17 AM
|
Joined: Jul 2011
Posts: 34,430
Boxes Cove
2Dogs
Freak of Nature
|
Freak of Nature
Joined: Jul 2011
Posts: 34,430
Boxes Cove
|
I know the more you hunt the better your chances are, but if you was only going to take a week off to hunt, were on the graph do you think the most buck movement would be Not so fast! If you spend a lot of time in a big bucks core area , before "the time is right" and he's on his feet in daylight, your chances go down in most cases. There's deer hunting, then there's hunting old mature bucks.
"Why do you ask"?
Always vote the slowest path to socialism.
|
|
|
|